Documentation for C-Werk 2.0.
Previous page Next page

To view the system status data, do the following:
- Go to the web interface of the self-diagnostics service: http://127.0.0.1:20040/.
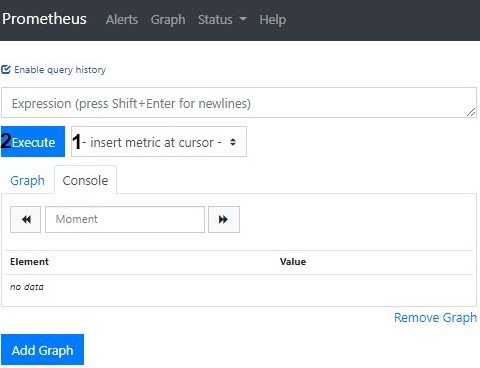
Select the required metric in the list (1) or enter the query in the Expression field.
The request allows for:
Using multiple metrics.
Using expressions to find problems. For example, a query like ngp_fps <17 will return all metrics, where FPS was less than 17. For a complete list of logical and arithmetic operators, see the official Prometheus documentation.
Filtering by any of the parameters. For example, a query like
ngp_fps{ep_name=~"hosts/TEST/DeviceIpint.2/SourceEndpoint.video:0:0"}will return FPS values only for the specified source.
Examples of useful queries for Windows:
The CPU loading graph similar to the Windows System monitor:sum by (process_id) (100 / scalar(wmi_cs_logical_processors) * (irate(wmi_process_cpu_time_total{process="AppHost"}[10m]))) or ngp_cpu_total_usageThe graph of RAM usage by the AppHost processes and a total memory space:
sum by (process_id) (avg_over_time(wmi_process_working_set{process="AppHost"}[5m])) / 1024 or avg_over_time(wmi_os_virtual_memory_bytes[5m]) / 1024The percentage of RAM usage:
100.0 - 100 * avg_over_time(wmi_os_virtual_memory_free_bytes[5m]) / avg_over_time(wmi_os_virtual_memory_bytes[5m])
Click the Execute button (2).
The Console tab will display all possible values of all elements at the time the query is completed.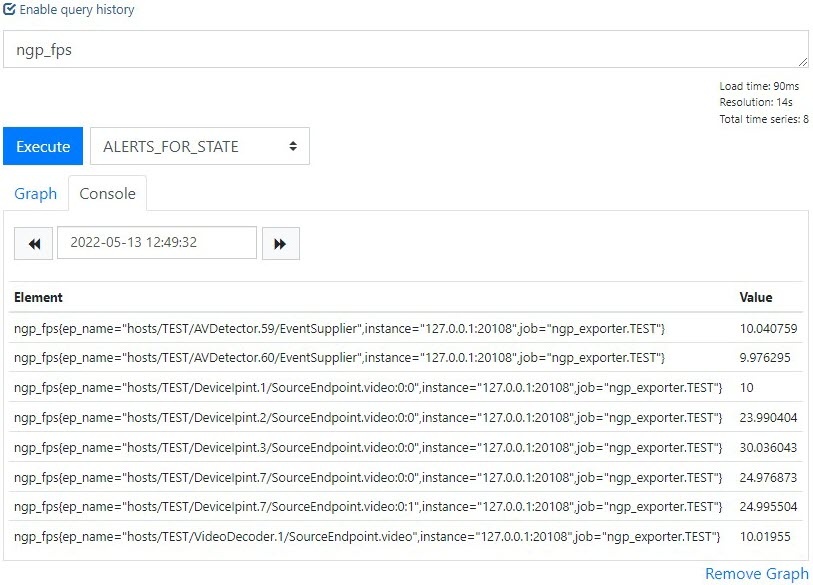
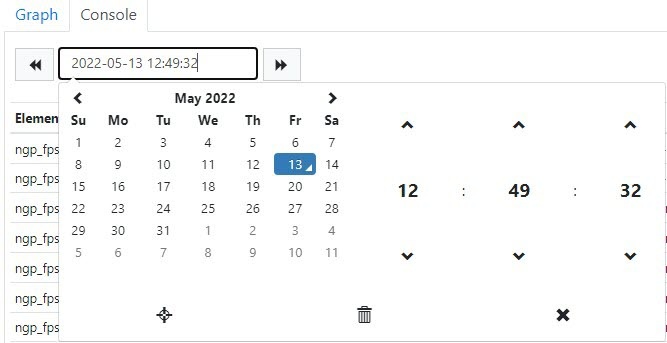
When you set a date and time in your calendar, the data will be updated.
To build a graph, go to the Graph tab.
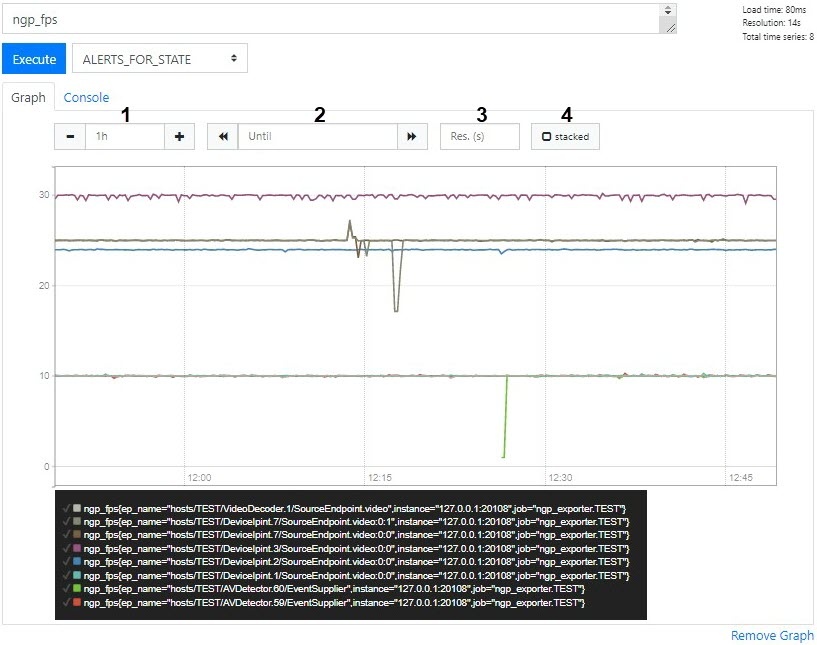
In the field 1, set the time interval of the graph. In the field 2, set its end point. In the filed 3, set the interval between the data points. To fill the chart, set the stacked (4) checkbox.
Overview
Content Tools